Mastering Infographic Videos: A Step-by-Step Guide

Infographic videos are cool visuals that mix pictures, text, and animation to explain stuff easily. They’re great for social media, websites, and presentations because they grab attention fast.

In the online world, where people’s focus is short and competition is tough, infographic videos shine. They’re like magic wands in marketing. Catching people’s eyes and getting messages across. Boosting your brand awareness and engaging viewers.

This article is all about making awesome infographic videos. We’ll dig into design basics, storytelling tricks, and how to share them. It’s a guide for marketers, creators, and business owners. It will help you make standout infographic videos for your marketing efforts.

This article dives into the secrets of making cool infographic videos. The kind that people love. We’ll cover simple design tips, storytelling magic, and smart ways to share them. By the end, you will be ready to make your awesome infographic videos.

Understanding Infographic Videos

These are fun slideshows with pictures, text, and moving images that explain stuff. They’re like animated stories that make learning easy and enjoyable. These videos work by combining visuals and words to tell a story or share information. They make complex ideas easier to understand. They’re great for grabbing attention and keeping viewers engaged. Because they’re dynamic and appealing.

Infographic videos have some cool advantages over regular infographics.

First off, they’re more eye-catching and engaging because they move and have sound. This makes them stand out in crowded social media feeds or websites. Plus, they can convey information faster and more effectively. Because they use both visuals and audio. People are more likely to remember what they see and hear. As compared to reading text or looking at static images.

Want to see some examples of awesome infographic videos? Check out companies like TED-Ed, Kurzgesagt, and National Geographic. They’re masters at creating captivating infographic videos that educate and entertain. 

From explaining complex scientific concepts to showcasing historical events. These videos cover a wide range of topics in an engaging way. Watching these examples can give you inspiration and ideas for your infographic videos.

Planning Your Infographic Video

Infographic Videos

Before you start, it’s important to know who you’re making it for. Also, what you want to achieve. Think about who your audience is and what you want them to learn or do after watching your video.

Understanding your audience and goals will help you create a video that resonates with your viewers. And then you’ll be able to achieve your objectives.

Once you’ve identified your audience and goals, it’s time to gather content and data.

Do some research to find relevant information and statistics that support your message. Collect images, graphics, and other visual elements. These will help illustrate your points and make your video more engaging. The more information and data you have, the better. This way you’ll be able to create a compelling and informative video.

Storyboarding and scriptwriting are crucial steps in the infographic video creation process.

Storyboarding involves sketching out the visual elements and sequence of your video. Whereas, scriptwriting involves writing the narration or dialogue. Think about how you want to structure your video and what key points you want to convey. Write a clear and concise script that communicates your message. Planning out your storyboard and script will help ensure that your infographic video flows smoothly and effectively communicates your message to your audience.

Designing and Creating Your Infographic Video

Selecting the correct tools is the first step to creating something amazing. Look for programs that offer features like drag-and-drop functionality and pre-designed templates. Some popular options include Canva, Adobe Spark, and Animaker. These tools make it easy to create professional-looking videos without any design experience.

Afterward, it’s time to incorporate visual elements and animation into your infographic video. Use eye-catching graphics, charts, and icons to visualize your data. And make your content more engaging. Add animation effects like transitions and motion graphics. That’ll bring your infographic to life and capture your audience’s attention.

Adding voiceover and music can enhance the impact of your infographic video. Record a clear and engaging voiceover that explains the key points. This will guide viewers through the content. Choose background music that complements the tone and message of your video. But, be sure to keep it subtle so it doesn’t overpower the narration. By combining voiceover and music, you can create a dynamic and engaging infographic video. A video that communicates your message to your audience.

Editing and Finalizing Your Infographic Video

Reviewing and Editing for Clarity and Cohesion

Before finishing your infographic video, check it carefully for clarity and coherence. Watch it several times to ensure the information flows smoothly and makes sense. Look for any mistakes or inconsistencies in the visuals, text, or narration, and fix them. 

Pay attention to how the video moves from one part to another to keep viewers interested. By reviewing and editing your infographic video well, you can make sure it effectively gets your message across.

Optimizing for SEO and Social Sharing

Once your infographic video is complete, optimize it for search engines and sharing on social media. 

Pick a title that describes the video well and includes keywords. Write a good description that explains what the infographic is about and uses keywords naturally. Add tags and categories to help people find your video on platforms like YouTube. 

Also, think about creating an attractive thumbnail that makes people want to click on your video. Share your infographic video on social media and ask people to like, comment, and share it.

Finalizing and Exporting the Video

After you’ve optimized your infographic video, finalize and export it. Make sure all the settings are correct and the video is ready to share. Choose the right file format and quality for where you’ll be sharing it. Save the video to your computer and make copies to keep it safe. 

Watch the exported video one more time to check everything looks good. Once you’re happy with it, you can share your infographic video with everyone.

Promoting and Distributing Your Infographic Video

Spread the word about your infographic video by sharing it on social media platforms. Choose the platforms where your target audience is most active, such as Facebook, Twitter, LinkedIn, and Instagram. Craft engaging posts that include a brief description of your video and an eye-catching thumbnail or preview. 

Encourage your followers to watch, like, comment, and share your video with their networks. Engage with your audience by responding to comments and questions, and consider running paid promotions to reach a wider audience.

Embedding on Your Website or Blog

Increase the visibility of your infographic video by embedding it on your website or blog. Choose a prominent location where visitors are likely to see it, such as your homepage or a dedicated blog post. 

Write a compelling introduction to your video and provide context for why it’s relevant to your audience. Use visually appealing design elements to draw attention to the video and make it easy for visitors to click play. Consider adding a call-to-action prompting visitors to take further action, such as subscribing to your newsletter or exploring related content.

Outreach to Influencers and Collaborators

Extend the reach of your infographic video by reaching out to influencers and collaborators in your niche. Identify individuals or organizations with a large following and a strong presence in your industry. Craft personalized outreach messages introducing yourself and your video, and explain why it would be valuable to their audience. 

Offer to collaborate on promoting the video through their channels, such as sharing it on social media, featuring it in a blog post, or including it in a newsletter. Build genuine relationships with influencers and collaborators to establish long-term partnerships and amplify the impact of your infographic video.

Summary

Learning to make and share infographic videos can boost your content marketing. Understand the basics, plan well, and get creative to make engaging videos that teach and entertain. Share your video on social media, add it to your website, and team up with influencers to spread the word. 

Also, think about getting help from an expert web design services company that can make your website look great. With smart promotion and cool videos, you’ll connect better with your audience and stand out online. 

And for that, there is no better choice than us!

How to Make Amazing Infographic Videos for Your Business

Infographic videos are one of the most effective ways to communicate complex or interesting information to your audience. They combine the power of visuals, animations, and text to make your data and message more engaging and memorable. 

They can help you boost your brand awareness, increase your traffic, and improve your conversions. But how do you make infographic videos that stand out from the crowd and achieve your goals? 

In this article, we will show you how to make amazing infographic videos for your business using different methods.

What are infographic videos and why should you use them?

Infographic videos are a type of video content that uses graphics, icons, charts, graphs, and text to present information or data visually and dynamically. 

They are similar to traditional infographics, but they use motion and sound to make the information more appealing and interactive. Infographic videos are popular and powerful tools for marketing, education, and communication, as they can:

  • Capture the attention of your audience with visual elements and animations
  • Simplify and summarize a large amount of information or data
  • Highlight the key points and main messages of your topic
  • Provide value and insight to your audience
  • Increase your brand awareness and credibility
  • Boost your SEO and social media presence

How to make infographic videos using a template

One of the easiest ways to make infographic videos is to use a template. A template is a pre-made video that has placeholders for your text and graphics. As well as a predefined design and layout. 

Using a template can save you time and effort. Because you don’t have to start from scratch or worry about the technical aspects of video production. Here are the steps to make infographic videos using a template:

Evaluate your audience and purpose

Before you choose a template, you need to consider who you are making the video for. Also, what do you want to achieve with it? This will help you select a template that suits your topic, tone, and style.

Search for a template

To find a template, you can use an online video maker platform, such as Biteable, Renderforest, or Visme. These platforms offer a variety of free and paid templates. You can use these to make infographic videos for different purposes and audiences. You can also use the filters to narrow down your search by category, theme, or duration.

Edit and customize the template

Once you find a template that you like, you can edit and customize it according to your content and preferences. You can replace the placeholder text with your information, and change the fonts, colors, and sizes as you wish. Also, you can insert or delete images, icons, charts, graphs, and other elements to suit your needs. You can also add voiceovers, music, or sound effects to enhance your video.

Preview and download your video

When you are done editing and customizing your video, you can preview it to see how it looks and sounds. You can also make any adjustments or corrections if needed. Then, you can download your video in your preferred format and quality, or share it directly to your website or social media platforms.

How to make infographic videos without a template

Infographic Videos

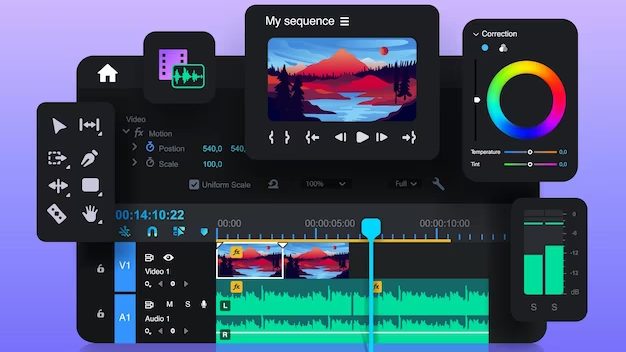
If you want to make infographic videos without a template, you can use video editing software, such as Adobe Premiere Pro, Final Cut Pro, or Camtasia. This software allows you to create and edit your video from scratch, using your footage, graphics, and audio. This method gives you more control and flexibility over your video content and style, but it also requires more time and skill. Here are the steps to make infographic videos without a template:

Choose the video size and duration

To make an infographic video, you need to choose the size and duration of your video. You can use the standard video sizes, such as 1920×1080 (full HD) or 1280×720 (HD), or choose a custom size that fits your platform and purpose. You also need to decide how long your video will be, depending on the amount and complexity of your information. Generally, infographic videos are concise, ranging from 30 seconds to 3 minutes.

Plan and outline your video content

Before you start making your video, you need to plan and outline your video content. You need to decide what information and data you want to include in your video, and how you want to organize and present it. You can use a storyboard, a script, or a mind map to plan and outline your video content.

Create and import the elements of your video

To create and import the elements of your video, you can use the tools and features that your video editing software offers. You can create and import various elements, such as:

Footage

You can record your footage using a camera, a smartphone, or a screen recorder, or you can use stock footage from online sources, such as Pixabay or Pexels. You can also use animations or motion graphics to create your footage.

Graphics

You can create your graphics using graphic design software, such as Adobe Illustrator or Canva, or you can use stock graphics from online sources, such as Flaticon or Freepik. You can also use shapes, icons, logos, and symbols to create your graphics.

Charts and graphs

You can create your charts and graphs using spreadsheet software, such as Microsoft Excel or Google Sheets, or you can use online tools, such as Infogram or ChartBlocks. You can also use animations or motion graphics to create your charts and graphs.

Text

You can add text to your video using the text tool in your video editing software, or you can create your text using graphic design software. You can also use WordArt, shapes, or animations to create text effects and styles.

Audio

You can record your voiceover using a microphone, a smartphone, or a voice recorder, or you can use online tools, such as [Natural Readers] or [VoiceBunny]. You can also add music or sound effects to your video using online sources, such as [YouTube Audio Library] or [Bensound].

Edit and format the elements of your video

To edit and format the elements of your video, you can use the tools and features that your video editing software offers. You can edit and format various elements, such as:

Trimming and cutting

You can trim and cut your footage, graphics, charts, graphs, and audio to remove any unwanted or unnecessary parts, and to adjust the length and timing of your elements.

Resizing and cropping

You can resize and crop your footage, graphics, charts, graphs, and text to fit the size and aspect ratio of your video, and to focus on the important or relevant parts of your elements.

Rotating and flipping

You can rotate and flip your footage, graphics, charts, graphs, and text to change the orientation and direction of your elements and to create different effects and perspectives.

Transitions and effects

You can add transitions and effects to your footage, graphics, charts, graphs, and text to create smooth and seamless changes between your elements, and to enhance the visual appeal and impact of your elements.

Color and brightness

You can adjust the color and brightness of your footage, graphics, charts, graphs, and text to improve the quality and clarity of your elements, and to create different moods and tones for your video.

Arrange and align the elements of your video

To arrange and align the elements of your video, you can use the tools and features that your video editing software offers. You can arrange and align your elements by:

Grouping and ungrouping

You can group and ungroup your elements to move, resize, or rotate them as a single unit, or to apply the same editing or formatting to them. To group your elements, select them and use the group command in your video editing software. To ungroup your elements, select them and use the ungroup command in your video editing software.

Ordering and layering

You can order and layer your elements to change their position and overlap in your video. To order your elements, select them and use the order command in your video editing software, such as bring to front, send to back, bring forward, or send backward. To layer your elements, select them and use the layer command in your video editing software, such as move up, move down, move to top, or move to bottom.

Aligning and distributing

You can align and distribute your elements to make them look neat and balanced in your video. To align your elements, select them and use the align command in your video editing software, such as align left, align center, align right, align top, align middle, or align bottom. To distribute your elements, select them and use the distribute command in your video editing software, such as distributing horizontally or vertically.

Preview and export your video

When you are done creating and editing your video, you can preview it to see how it looks and sounds. You can also make any adjustments or corrections if needed. Then, you can export your video in your preferred format and quality, or share it directly to your website or social media platforms.

Wrap-up

Infographic videos are a great way to communicate complex or interesting information to your audience visually and dynamically. They can help you boost your brand awareness, increase your traffic, and improve your conversions. 

If you’re looking for professional assistance to enhance your website’s design, visibility, and overall performance, our web design services are here to help. We specialize in creating websites that not only look stunning but also adhere to the best practices for search engine optimization. Contact us today, and let’s embark on a journey to elevate your website’s natural rank and overall digital success.

This is the end of the article. I hope you enjoyed reading it and found it helpful. Thank you for your time and attention. Have a great day!

08 List Infographic Templates to Simplify Your Data

List infographic templates are infographic templates that use lists to organize and present data simply and clearly. These templates can help you create infographics that are easy to read and understand, and that highlight the key points and facts of your data.

Furthermore, list infographic templates are ideal for:

  • Comparing and contrasting different items or categories
  • Showing the steps or stages of a process or a timeline
  • Providing tips, advice, or recommendations
  • Ranking or ordering items by importance, popularity, or value
  • Summarizing or highlighting the main points of a topic or an article

In this article, we will show you 08 list infographic templates that you can use to simplify your data and create stunning infographics. We will also provide some tips and best practices on how to use list infographic templates effectively.

List Infographic Templates

1. Checklist Infographic Template

A checklist infographic template uses checkboxes to show the completion or progress of a task or a goal. It can help you create infographics that are motivational, instructional, or educational.

For example, you can use a checklist infographic template to:

  • Show the steps or requirements of a project or a plan
  • Provide a guide or a tutorial on how to do something
  • Share a list of best practices or tips on a topic
  • Create a to-do list or a goal list for yourself or your audience

Here is an example of a checklist infographic template:

2. Numbered List Infographic Template

A numbered list infographic template uses numbers to order or rank items or categories. It can help you create infographics that are informative, persuasive, or entertaining.

For example, you can use a numbered list infographic template to:

  • Show the ranking or popularity of items or categories
  • Provide a countdown or a count-up of items or events
  • Share a list of facts, statistics, or trivia on a topic
  • Create a list of tips, advice, or recommendations on a topic

Here is an example of a numbered list infographic template:

3. Bullet Point List Infographic Template

A bullet point list infographic template uses bullet points to organize and present items or categories. Such templates can help you create infographics that are simple, concise, and clear.

For example, you can use a bullet point list infographic template to:

  • Show the features or benefits of a product or a service
  • Provide a summary or a highlight of a topic or an article
  • Share a list of resources, tools, or references on a topic
  • Create a list of points, arguments, or opinions on a topic

Here is an example of a bullet point list infographic template.

4. Icon List Infographic Template

An icon list infographic template uses icons to represent or illustrate items or categories. An icon list infographic can help you create infographics that are visual, attractive, and engaging.

For example, you can use an icon list infographic template to:

  • Show the types or categories of items or concepts
  • Provide a visual guide or a tutorial on how to do something
  • Share a list of tips, advice, or recommendations on a topic
  • Create a list of facts, statistics, or trivia on a topic

Here is an example of an icon list infographic template.

5. Timeline List Infographic Template

A timeline list infographic template uses a timeline to show the sequence or progression of items or events. It can help you create infographics that are historical, chronological, or logical.

For example, you can use a timeline list infographic template to:

  • Show the history or evolution of a topic or a concept
  • Provide a timeline or a roadmap of a project or a plan
  • Share a list of milestones, achievements, or events on a topic
  • Create a list of steps, stages, or phases of a process or a cycle

Here is an example of a timeline list infographic template.

6. Comparison List Infographic Template

A comparison list infographic template is a list infographic template that uses a comparison or a contrast to show the similarities or differences between items or categories. A comparison list infographic template can help you create infographics that are analytical, evaluative, or persuasive.

For example, you can use a comparison list infographic template to:

  • Show the pros and cons of the advantages and disadvantages of a topic or a concept
  • Provide a comparison or a contrast of two or more items or categories
  • Share a list of criteria, standards, or factors to consider on a topic
  • Create a list of recommendations, suggestions, or solutions on a topic

Here is an example of a comparison list infographic template.

7. Flowchart List Infographic Template

A flowchart list infographic template uses a flowchart to show the flow or the direction of items or events. Such templates are used to create infographics that are directional, procedural, or conditional.

For example, you can use a flowchart list infographic template to:

  • Show the flow or the direction of a process or a cycle
  • Provide a flowchart or a diagram of a system or a structure
  • Share a list of options, choices, or outcomes on a topic
  • Create a list of questions, answers, or solutions on a topic

Here is an example of a flowchart list infographic template.

8. Pyramid List Infographic Template

A pyramid list infographic template uses a pyramid to show the hierarchy or the priority of items or categories. It can help you create infographics that are hierarchical, prioritized, or segmented.

For example, you can use a pyramid list infographic template to:

  • Show the hierarchy or the priority of items or categories
  • Provide a pyramid or a model of a concept or a theory
  • Share a list of levels, stages, or phases of a topic or a process
  • Create a list of goals, objectives, or strategies on a topic

Here is an example of a pyramid list infographic template.

Let us Help with Your Web Design!

If you’re looking for professional assistance to enhance your website’s design, visibility, and overall performance, our web design services are here to help. We specialize in creating websites that not only look stunning but also adhere to the best practices for search engine optimization. Contact us today, and let’s embark on a journey to elevate your website’s natural rank and overall digital success.

Infographic Project: How To Plan And Execute a Successful One

An infographic project is a creative way to present complex data and information in a visual and engaging format. Infographics can help you communicate your message in a crystal clear way. It can also help you attract more attention, and increase your brand awareness. 

But how do you plan and execute a successful infographic project? In this article, we will share some tips and best practices. They are sure to help you create stunning infographics for your business or personal needs.

Define Your Goal and Audience

Firstly, define your goal and audience. What is the purpose of your infographic? What do you want to achieve with it? Who are you trying to reach and influence? These questions will help you narrow down the topic, scope, and tone of your infographic. 

For example, if your goal is to educate your customers about a new product, you might want to use simple and clear language. A friendly and professional tone, and a logical and informative structure.

Research and Collect Data

Secondly, research and collect data for your infographic. You need to find reliable and relevant sources of information that support your goal and message. That could be done using various online tools. You can also use other sources like books, journals, reports, surveys, and interviews. Make sure to verify the accuracy and credibility of your data, and cite your sources properly.

Choose a Template and Design Tool

Thirdly, once you have your data ready, you need to choose a template and design tool for your infographic. A template is a pre-made layout that you can customize with your content and style. 

A design tool is a software or application that you can use to create and edit your infographic. There are many free and premium options available online, such as Canva, Behance, and Slidesgo. 

These tools offer a variety of infographic templates for different needs and purposes, such as education, business, charity, research, and more. You can also create your own template from scratch if you have the skills and time.

Customize and Optimize Your Infographic

Lastly, customize and optimize your infographic. You need to add your data and information to your template and adjust the colors, fonts, icons, images, and charts to suit your theme and style. 

Also make sure that your infographic is easy to read and understand, by using short and simple words, writing short paragraphs, avoiding consecutive sentences, using many transition words, and eliminating hard-to-read or redundant words. You can also use headings, subheadings, bullet points, and numbers to organize your content and highlight the key points. 

Finally, you need to optimize your infographic for your intended platform and audience, by choosing the right size, format, and resolution, and adding a catchy title, a logo, and a call to action.

How to Share and Promote Your Infographic

After creating and optimizing your infographic, you need to share and promote it to reach your target audience and increase your visibility. There are many ways to share and promote your infographic, depending on your goal and platform. Here are some tips and suggestions:

  • Share your infographic on your website or blog. You can embed your infographic as an image or a link, or use a plugin or widget to display it on your site. Make sure to optimize your site for SEO, by using relevant keywords, meta tags, and alt text for your infographic.
  • Share your infographic on social media. You can post your infographic on popular platforms like Facebook, Twitter, Instagram, Pinterest, and LinkedIn, and use hashtags, captions, and tags to attract more attention. You can also join groups, communities, and forums related to your topic, and share your infographic with them.
  • Share your infographic on online platforms and directories. You can submit your infographic to online platforms and directories that specialize in infographics, such as Visual.ly, Infographic Journal, and Daily Infographic. These platforms can help you showcase your infographic to a wider and relevant audience, and generate more traffic and backlinks to your site.
  • Share your infographic with influencers and media outlets. You can reach out to influencers and media outlets that are interested in your topic, and ask them to share your infographic with their followers and readers. For that, you can use tools like BuzzSumo and Hunter to find and contact influencers and media outlets in your niche. You can also create a press release or a pitch email to introduce your infographic and explain why it is valuable and newsworthy.

Ending Notes

An infographic project is a great way to showcase your data and information visually and engagingly. By following these steps, you can plan and execute a successful infographic project that will impress your audience and achieve your goal. 

Looking to enhance your online presence and captivate your audience with a stunning website? Our expert web design services are tailored to your unique needs. Contact us today to elevate your brand and leave a lasting impression on the digital landscape. Your success is just a click away!

Scroll to Top